Selection and curation of IscB orthologs
The extended database of IscB sequences generated previously14 was collected, resulting in diverse genomic and metagenomic loci containing IscB proteins along with their closest 50% sequence identity cluster representative in the previously described IscB, IsrB and Cas9 phylogenetic tree. For each locus that was selected to be experimentally tested, the full IscB system was generated as follows. First, the putative IscB coding sequences and ωRNAs, as previously determined, were refined as follows. All protein sequences within the same 50% sequence identity cluster were aligned to the candidate IscB protein using multiple alignment using fast Fourier transform (MAFFT)43. If the candidate IscB protein contained a large (≥50 aa) C-terminal insertion relative to the other proteins within the cluster, the locus was discarded. If the candidate IscB protein contained an N-terminal insertion (≥10 aa) but contained a downstream start codon site that would eliminate the insertion without removing any of the conserved N-terminal PLMP domain (previously named after the frequently observed PLMP amino acid motif in this domain), the downstream start site was selected in place of the computationally determined start site. For metagenomic sequences with multiple related protein sequences within the same 95% sequence identity cluster, all proteins within the cluster were aligned using MAFFT43. The most accurate IscB protein sequence was determined to be the one that most closely matched the consensus sequence of this alignment. If the candidate IscB locus did not contain the most accurate IscB protein sequence, the candidate locus was switched to the locus that contains the most accurate IscB protein sequence. For determination of ωRNA boundaries, the upstream region of the IscB protein coding sequence was aligned using MAFFT43 to loci from the same 50% sequence identity IscB protein cluster as well as phylogenetically related loci as determined by the previously determined phylogenetic tree14. The 3′ boundary of the ωRNA was selected to be ~2 bp upstream from the protein start site to match experimentally observed ωRNA boundaries. The 5′ end of the ωRNA was selected as the 5′ end determined by the CMAlign covariance model for the corresponding ωRNA type14 if the first two bases of the 5′ of the CMAlign model matched the first two bases of the ωRNA coding sequence in the given locus. However, in cases in which the model and the candidate ωRNA did not agree at the 5′ end, the ωRNA 5′ location was determined to be the 5′ most position where a sharp increase in conservation in the alignment was observed, signifying the beginning of the ωRNA. In cases in which the ωRNA 5′ could not be resolved, the candidate locus was discarded.
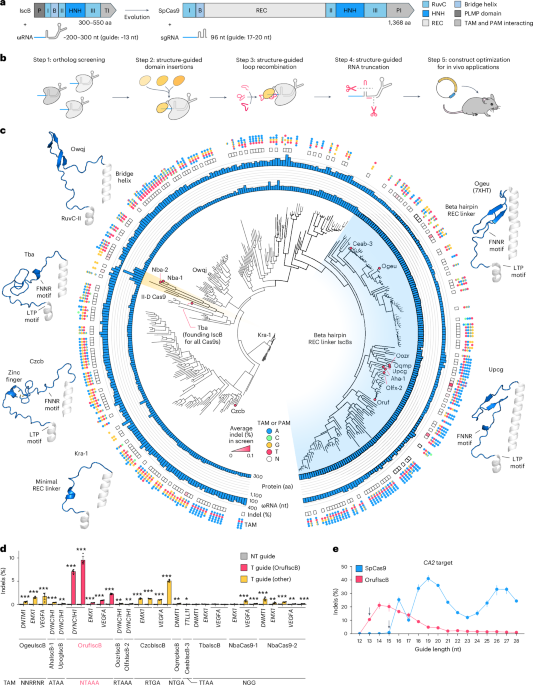
Multiple criteria were used to select the initial set from the large set of possible IscBs to be tested experimentally. The main criterion was phylogenetic diversity—we sampled systems from representative branches across the previously described phylogenetic tree14. The next criterion was human-related pathogens. For this subset, NCBI taxon IDs were matched when available to candidate IscB loci when available. IscB loci belonging to bacteria known to have human hosts were selected for this round. For another criterion, IscBs with REC-like insertions were prioritized. For this subset, IscBs were aligned using MAFFT43 and the alignment columns between the bridge helix and RuvC-II domains were inferred as REC-like insertions. Candidate IscBs with insertions (>20 aa) in this region were selected for their potential REC-like domains. For the second set, we selected IscB systems based on similarity along the tree to other systems that we found had genome editing activity in human cells.
AlphaFold2 models of tested orthologs were generated as follows. Each tested protein sequence was searched against the full dataset of all IscBs and Cas9s described previously14 using MMSeqs2 keeping the top 501 protein hits (sorted by e-value) beyond the query protein44. Alignments were generated using clustal omega45 and used as input multiple sequence alignments for AlphaFold2 running under ColabFold package27,46 without the use of templates and with up to 16 recycles using model 3, stopping if the pLDDT exceeds 95 and using Amber relaxation for the side chains.
A phylogenetic tree of the main tested type II-D and IscB orthologs, excluding CasIscBs, though including TbaIscB due to its relationship as the founding member of type II-D Cas9s, was constructed as follows. All tested IscBs were aligned with MAFFT-einsi43, and then alignment columns with >50% gaps were removed. The processed alignment was then used to create a phylogenetic tree using IQ-Tree2 default parameters with 2,000 ultra fast bootstraps and using the optimal substitution model determined by ModelFinder47,48. Protein length and ωRNA length for each system were determined based on the manually curated sequences for the protein and ωRNA, respectively. IVTT-determined TAM sequences and human genome editing activity (through the multi-guide panel) were determined experimentally as described in the sections below.
Cell-free transcription–translation TAM interference assay
IscB protein sequences were human codon optimized using the GenScript codon optimization tool. IscB genes and ωRNA scaffolds were custom synthesized by Twist Biosciences, and transcription–translation templates were generated by PCR from custom synthesis products. Cell-free transcription–translation reactions were carried out using a PURExpress In Vitro Protein Synthesis Kit (NEB) as per the manufacturer’s protocol with half-volume reactions, using 75 ng of template for the protein of interest, 125 ng of template for the corresponding ωRNA with a guide targeting the TAM library and 25 ng of TAM library plasmid. Reactions were incubated at 37 °C for 4 h, then quenched by placing at 4 °C or on ice and adding 10 µg RNase A (Qiagen) and 8 units Proteinase K (NEB) each followed by a 5-min incubation at 37 °C. DNA was extracted by PCR purification columns and adaptors were ligated using an NEBNext Ultra II DNA Library Prep Kit for Illumina (NEB) using the NEBNext Adaptor for Illumina (NEB) as per the manufacturer’s protocol. Following adaptor ligation, cleaved products were amplified specifically using one primer specific to the TAM library backbone and one primer specific to the NEBNext adaptor with a 12-cycle PCR using NEBNext High Fidelity 2X PCR Master Mix (NEB) with an annealing temperature of 63 °C, followed by a second 18-cycle round of PCR to further add the Illumina i5 adaptor. Amplified libraries were gel extracted, quantified by qPCR using a KAPA Library Quantification Kit for Illumina (Roche) on a StepOne Plus machine (Applied Biosystems, Thermo Fisher Scientific) and subject to single-end sequencing on an Illumina MiSeq with read 1 80 cycles, index 1 8 cycles and index 2 8 cycles. TAMs were extracted and the enrichment score for each TAM or PAM was calculated by filtering for all TAMs or PAMs present more than once and normalizing to the TAM or PAM frequency in the input library subject to the same IVTT and quenching reactions. A position weight matrix based on the enrichment score was generated, and both WebLogos and Krona plots were visualized based on this position weight matrix using a custom Python script.
Mammalian cell culture and transfection
Mammalian cell culture experiments were performed in the HEK293FT line (Thermo Fisher Scientific) and AML12 line (CRL-2254, ATCC). HEK293FT cells were grown in Dulbecco’s modified Eagle medium with high glucose, sodium pyruvate and GlutaMAX (Thermo Fisher Scientific). AML12 cells were grown in Dulbecco’s modified Eagle medium/Nutrient Mixture F-12 (Thermo Fisher Scientific), supplemented with 40 ng ml−1 dexamethasone (Sigma-Aldrich) and 1× Insulin–Transferrin–Selenium (Thermo Fisher Scientific). All cells were additionally supplemented with 1× penicillin–streptomycin (Thermo Fisher Scientific), 10 mM HEPES (Thermo Fisher Scientific) and 10% fetal bovine serum (VWR Seradigm). All cells were maintained at confluency below 80%.
For DNA transfection, all transfections were performed with Lipofectamine 3000 (Thermo Fisher Scientific). Cells were plated 16–20 h before transfection to ensure 90% confluency at the time of transfection. For 96-well plates, cells were plated at 20,000 cells per well, and for 24-well plates, cells were plated at 100,000 cells per well. For each well on the plate, transfection plasmids were combined with 2 µl of P3000 solution per every 1 µg DNA and OptiMEM I Reduced Serum Medium (Thermo Fisher Scientific) to a total of 25 µl. Separately, 23 µl of OptiMEM was combined with 2 µl of Lipofectamine 3000. Plasmid and Lipofectamine solutions were then combined and pipetted onto cells.
For RNA transfection, all transfections were performed with Lipofectamine MessengerMAX transfection reagent (Thermo Fisher Scientific). Cells were plated similarly to the DNA transfections described above. For each well of 96-well plates, a total amount of 200 ng RNA was combined with 0.6 µl Lipofectamine MessengerMAX reagent and OptiMEM to make 10 µl of transfection mixture, which was pipetted onto cells. For different mass ratios (1:4, 1:2, 1:1, 2:1, 4:1) of in vitro-transcribed ωRNAs to mRNAs (OMEGAoff construct), ωRNA and mRNA were combined at the indicated ratio in a total of 200 ng RNA. ωRNA templates were amplified using Q5 High-Fidelity DNA Polymerase (NEB) and purified with QIAquick spin columns (Qiagen), and RNA was transcribed using a HiScribe T7 Quick High Yield RNA Synthesis Kit (NEB) and purified using an RNA Clean & Concentrator-25 Kit (Zymo Research). For mRNA encoding the OMEGAoff protein, we first digested a plasmid encoding the protein using AanI (Thermo Fisher Scientific) to obtain a linear DNA fragment. In vitro transcription (IVT) reactions were assembled with T7 buffer (NEB), 100 mM ATP (NEB), 100 mM GTP (NEB), 100 mM CTP (NEB), 100 mM pseudo-UTP (Trilink), CleanCap AG (Trilink) and T7 RNA Polymerase (NEB) and incubated at 37 °C for 5 h. The reaction was further treated with TURBO DNAse enzyme (Thermo Fisher Scientific) followed by LiCl (Thermo Fisher Scientific)-based purification before transfection as described.
Mammalian genome editing
ωRNA scaffold backbones were cloned into a pUC19-based human U6 expression backbone by Gibson Assembly. Human codon-optimized IscB genes were cloned into an immediate early promoter enhancer of cytomegalovirus (CMV) expression backbone by Gibson assembly using 2X Gibson Assembly Master Mix (NEB) to generate pCMV-SV40 NLS-IscB protein-nucleoplasmin NLS-3xHA constructs. For initial testing, 12-guide libraries were cloned in a pool mixing primers to add each of the 12 guides in a given pool at equimolar ratios, and ωRNA scaffold backbones were subject to whole plasmid amplification with guide primers annealing to the U6 promoter and a second primer annealing to the start of the ωRNA scaffold using Phusion Flash High-Fidelity 2X Master Mix (Thermo Fisher Scientific). PCR products were gel extracted and eluted in 30 μl, then blunt-end ligated to circularize by addition of 5 units T4 PNK (NEB), 200 units T4 DNA Ligase (NEB) and final 1X T4 DNA Ligase Buffer (NEB) followed by incubation for 1.5 h at room temperature before transformation in Stbl3 chemically competent Escherichia coli (NEB). For individual guide constructs, oligos with appropriate overhangs were synthesized by Genewiz, annealed and phosphorylated using T4 PNK (NEB) and cloned into ωRNA backbones by restriction–ligation cloning. Human codon-optimized IscB genes were cloned into a CMV expression backbone by Gibson assembly using 2X Gibson Assembly Master Mix (NEB) to generate pCMV-SV40 NLS-IscB protein-nucleoplasmin NLS-3xHA constructs.
Before individual guides were tested, each tested IscB protein was screened for activity in HEK293FT cells using a pool of 12 guides cloned as described. For this 12-guide pooled initial screening of IscB proteins, 800 ng of protein expression construct and 800–1,200 ng of the corresponding guide pool with corresponding ωRNA scaffold were transfected in one well of a 24-well plate as described. After 60–72 h, genomic DNA was collected by washing the cells once in 1× Dulbecco’s phosphate buffered saline (DPBS) (Sigma-Aldrich) and dry trypsinizing cells using TrypLE (Thermo Fisher Scientific). Trypsinized cells were collected in 1 ml 1× DPBS and pelleted by centrifugation at 300 × g at 4 °C for 5 min. The supernatant was removed, and cells were resuspended in 50 μl QuickExtract DNA Extraction Solution (Lucigen) and cycled at 65 °C for 15 min, 68 °C for 15 min and then 95 °C for 10 min to lyse cells. Then, 2.5 µl of lysed cells was used as input into each PCR. Amplification of each region targeted by a guide in a given guide pool was performed individually.
For all experiments in which individual guide sequences were used, unless otherwise indicated below, 100 ng guide expression plasmid and 100 ng protein expression plasmid were transfected in each of 3 or 4 wells as indicated as biological replicates in a 96-well plate for each guide condition as described. For the experiments in Fig. 2g, 50 ng guide expression plasmid and 100 ng protein expression plasmid were transfected. After 60–72 h, genomic DNA was collected directly without any enrichment of editing events by washing the cells once in 1× DPBS (Sigma-Aldrich) and adding 50 μl QuickExtract DNA Extraction Solution (Lucigen). Cells were scraped from the plates to suspend in QuickExtract and cycled at 65 °C for 15 min, 68 °C for 15 min and then 95 °C for 10 min to lyse cells. Subsequently, 2.5 µl of lysed cells was used as input into each PCR.
For library amplification, target genomic regions were amplified with a 12-cycle PCR using NEBNext High Fidelity 2X PCR Master Mix (NEB) with an annealing temperature of 63 °C for 15 s, followed by a second 18-cycle round of PCR to add Illumina adapters and barcodes. The libraries were gel extracted and subject to single-end sequencing on an Illumina MiSeq with read 1 300 cycles, index 1 8 cycles and index 2 8 cycles. Indel frequency was analyzed using CRISPResso2 (ref. 49), with a quantification window center of −9 and a window size of 6 based on a previous analysis of IscB cleavage patterns14. To eliminate noise from PCR and sequencing error, only indels with at least two reads or more than one base inserted or deleted were counted toward reported indel frequencies. For 12-guide pooled screens, read alignments were further inspected manually for presence of ‘true’ indels to select candidates for validation. For individual guide–ωRNA experiments, to assess statistical significance, two-tailed t-tests were performed using nontargeting guide–ωRNA conditions as a negative control. All indel data are available in Supplementary Table 2. Base editing frequency was analyzed using a previously reported Python script50, and all data are available in Supplementary Table 7. All the primer sequences used for genome PCR were listed in Supplementary Table 8.
Cell-free transcription–translation cleavage assays
To test the cleavage activities of OrufIscB with various REC insertions and NovaIscB variants on target dsDNA with different TAM sequences, cell-free transcription–translation reactions were performed using a PURExpress In Vitro Protein Synthesis Kit (NEB) with half-volume reactions, using 75 ng of template for the NovaIscB variant of interest, 125 ng of template for the ωRNA and 50 ng of target dsDNA. IVTT templates for IscB variants and ωRNAs were prepared as described in Cell-Free Transcription–Translation TAM Interference Assay. Target DNA was prepared by amplifying a pUC19 plasmid containing the target sequence and adjacent TAM with Cy3 and Cy5 primers (IDT) using Q5 Hot Start Hi-Fidelity 2X Master Mix (NEB) as per the manufacturer’s protocol with 3% DMSO added. The reactions were incubated at 37 °C for 4 h, then quenched using 10 µg RNase A (Qiagen) and 1 μl Proteinase K (Qiagen) by a 5 min incubation at 37 °C. DNA was extracted by PCR purification (Qiagen), run on 4% E-gels (Thermo Fisher Scientific) and imaged on a BioRad Chemidoc in the Cy5 channel to visualize cleavage products.
Cell-free transcription–translation mismatch tolerance assay
The target library was designed by selecting 100 random sites from coding sequences in the human genome (hg38 assembly) adjacent to ATAAA TAMs. Target sites were selected to avoid homopolymeric sequences of four or more Ts or Gs to avoid guides with potential termination signals for later use with PolIII promoters and those with potential to form G quadruplexes. Targets were also selected to have an edit distance of at least 3 away from all other targets in the TAM-proximal 7 bp and an edit distance of at least 10 in total. All possible single mismatches for each target were then generated, and progressive mismatch targets were also generated by selecting 8 sequences each with TAM-distal mismatches ranging from 2 to 7 bp at the 5′ end of the target, with an edit distance of at least 8 from any of the nontemplate original targets in the library. A total of 316 random sequences with an edit distance of at least 10 from all other library members were added as negative controls. In addition, 10 N randomized barcodes were added to each individual target for distinguishing target identity after cleavage. The library was synthesized by GenScript and cloned into a pUC19 vector by Gibson Assembly.
An associated guide library was synthesized by IDT and cloned into a backbone containing the OrufIscB ωRNA scaffold by Gibson Assembly. In vitro transcription templates for the pooled guide library were then generated by PCR and were transcribed using a HiScribe T7 Quick High Yield RNA synthesis kit (NEB). IVTT templates for IscB proteins with REC domain insertions were prepared as described in Cell-Free Transcription–Translation TAM Interference Assay. Cell-free transcription–translation reactions were carried out using a PURExpress In Vitro Protein Synthesis Kit (NEB) as per the manufacturer’s protocol with half-volume reactions, using 75 ng of template for the protein of interest, 1.5 μM final concentration of the in vitro-transcribed ωRNA guide library and 25 ng of target library plasmid. Cas9 and a guide targeting a nonlibrary control were also included as an internal activity control for downstream library preparation and sequencing. Reactions were carried out and libraries were prepared as in Cell-Free Transcription–Translation TAM Interference Assay. Barcodes were extracted and used for quantifying reads using a custom Python script. The relative activity score was calculated by dividing the cleaved read count for each perfectly matched target by the read count of the Cas9 target cleaved in each reaction, then each of those quotients was divided by the normalized read count of the same cleaved target in the WT condition in the same sequencing run. The median for each REC insertion was plotted, and any variants with an activity score of 0.5 or greater was assessed for effective guide length as measured by increasing mismatch tolerance at the TAM-distal end of the guide. For mismatch targets, the read count of all mismatch targets was normalized to the read count of the associated perfectly matched target to generate relative scores for cleavage of ‘off-target’ substrates.
Purification of IscB proteins
To purify OrufIscB, OrufIscB-REC and NovaIscB proteins, human codon-optimized IscB proteins were cloned into a pET45b(+) backbone with an N-terminal His14-Twin-strep-bdSUMO tag. These plasmids were transformed into BL21(DE3) competent cells (Thermo Fisher Scientific). Cells were grown at 37 °C in terrific broth (TB) medium supplemented with 100 μg ml−1 ampicillin. Once the culture reached an optical density of approximately 0.6, the culture was shifted to 18 °C and supplemented with 0.2 mM isopropyl β-d-1thiogalactopyranoside (IPTG) for overnight induction at 18 °C. The pellet was collected by centrifugation and resuspended in the lysis buffer (50 mM Tris (pH 8), 1 M NaCl, 5 mM MgCl2, 5% glycerol, 40 mM imidazole and 5 mM β-mercaptoethanol) with PMSF protease inhibitors. The pellets were lysed by passing twice through an LM20 Microfluidizer (Microfluidics) at 28,000 psi. The soluble fraction was collected after centrifugation at 15,060 × g for 30 min, then bound to Ni-NTA Agarose (Qiagen). The Ni beads were washed first with 12 column volumes (CV) of lysis buffer, then 5 CV of high-salt buffer (50 mM Tris (pH 8), 2 M NaCl, 5% glycerol, 5 mM MgCl2, 40 mM imidazole and 5 mM β-mercaptoethanol) and 5 CV of low-salt buffer (50 mM Tris (pH 8), 500 mM NaCl, 5% glycerol, 5 mM MgCl2, 40 mM imidazole and 5 mM β-mercaptoethanol) in turn. The proteins were eluted with elution buffer (50 mM Tris (pH 8), 500 mM NaCl, 5% glycerol, 5 mM MgCl2, 300 mM imidazole and 5 mM β-mercaptoethanol), cleaved using bdSENP1 protease to remove the N-terminal tag and then dialyzed overnight in dialysis buffer (50 mM Tris (pH 8), 500 mM NaCl, 5% glycerol, 5 mM MgCl2, and 5 mM β-mercaptoethanol). The proteins were concentrated, aliquoted and stored at −80 °C.
In vitro cleavage assay with purified proteins
For the in vitro cleavage assays, the labeled double-stranded DNA substrates were generated by PCR amplification of pUC19 plasmids containing the target and TAM sequences using Cy5 and DyLight800-conjugated DNA oligonucleotides (IDT) as primers as described in Cell-Free Transcription–Translation Cleavage Assays. All ωRNAs used in this assay were in vitro transcribed using the same protocol described in the RNA transfection protocol described in Mammalian Genome Editing. Each reaction of the cleavage assay contained 10 nM DNA substrate, 1.2 μM protein and 1.1 μM ωRNA in a final reaction buffer of 20 mM HEPES (pH 7.5), 50 mM NaCl and 5 mM MgCl2. Reactions were incubated at 42 °C for 1 h, followed by RNase A treatment (Qiagen) and proteinase K treatment (NEB). DNA was then purified with QIAquick spin columns (Qiagen), resolved by gel electrophoresis on E-gels (Thermo Fisher Scientific) and imaged on a BioRad Chemidoc imager.
TTISS
TTISS assays were performed as described12 with minor modifications as follows. Briefly, donor oligos (5′ – /5phos/G*T*TGTGAGCAAGGGCGAGGAGGATAACGCCTCTCTCCCAGCGACT*A*T – 3′ and 5′- /5phos/A*T*AGTCGCTGGGAGAGAGGCGTTATCCTCCTCGCCCTTGCTCACA*A*C – 3′, where * represents phosphothioate backbone modification) were annealed in nuclease-free duplex buffer (30 mM HEPES (pH 7.5), 100 mM potassium acetate) at a final concentration of 10 µM by incubating for 5 s at 95 °C and ramping down at 0.1 °C s−1 to 4 °C. HEK293FT cells were transfected in 12-well plates using GeneJuice (MilliporeSigma) as per the manufacturer’s instructions with 1 µg protein expression plasmid, 2 µg combined omegaRNA expression plasmids and 1.5 µg annealed donor oligos. Subsequently, 72 h after transfection, each well was washed with 1 ml Dulbecco’s PBS (MilliporeSigma) and dry trypsinized with 200 µl TrypLE (Thermo Fisher Scientific). Cells were resuspended in 1 ml PBS and centrifuged at 300 × g for 5 min at 4 °C to pellet. The pellet was resuspended in 200 µl PBS and used as input to the Qiagen DNEasy Blood & Tissue kit (Qiagen) to extract genomic DNA. Then, 2 µg of purified genomic DNA from each sample was mixed with 20 µl of purified Tn5 enzyme loaded with a Tn5 adaptor (5′-CTGTCTCTTATACACATCTCCGAGCCCACGAGAC-3′) and 1× TAPS buffer (10 mM TAPS, 1 mM MgCl2) and incubated at 55 °C for 10 min. Tagmented samples were purified using a QiaQuick DNA purification kit (Qiagen) and amplified twice using KOD Hot Start 2× PCR Master Mix (MilliporeSigma) with primers 5′-GTCGCTGGGAGAGAGGCGTTATC-3′ and 5′-GTCTCGTGGGCTCGGAGATGTGTATAAGAGACAG-3′ with 12 cycles and an annealing temperature of 60 °C in the first round of PCR, then with primers 5′-AATGATACGGCGACCACCGAGATCTACACTATAGCCTACACTCTTTCCCTACACGACGCTCTTCCGATCTTTATCCTCCTCGCCCTTGCTCAC-3′ and 5′-CAAGCAGAAGACGGCATACGAGATNNNNNNNNGTCTCGTGGGCTCGGAGATGTGT-3′ (NNNNNNNN refers to the barcode sequence) with 18 cycles and an annealing temperature of 65 °C in the second round of the PCR. Libraries were sequenced on an Illumina NextSeq. Within each experiment, the resulting FASTQ files were randomly downsampled so each sample had the same number of reads, for direct comparison. Across all experiments, at least 10 million and up to 50 million reads per sample were used for analysis. Reads were mapped using BrowserGenome.org (ref. 51). Off-targets for each guide were counted using a custom Python script, allowing for up to 7 mismatches in the guide sequence for 20-nt guides or 5 mismatches for 16-nt and 14-nt guides, and 1 mismatch in the TAM regardless of length. Libraries for associated on-target indel quantification were generated using the purified genomic DNA as described in Mammalian Genome Editing. For each variant, the specificity values (the percentages of total TTISS reads corresponding to detected off-targets) and activity values (the average indel fold changes of each variant versus WT OrufIscB across all guides included in each experiment) were plotted.
Mammalian base editing assays
Constructs expressing base editors and associated guide RNAs were transfected, genomic DNA was collected and libraries were prepared as described for individual protein–guide combinations in Mammalian Cell Culture and Transfection and Mammalian Genome Editing above. Editing was quantified by counting the number of reads at which the expected edited position in the amplicon was called as a G (on the top strand) or C (on the bottom strand) and dividing by the total number of reads in the sample using a previously described custom Python script50. Unless otherwise noted, all reported data are the average of four biological replicates.
Assessment of OMEGAoff by qPCR
Constructs expressing OMEGAoff or CRISPRoff proteins and associated guide RNAs were transfected as described for individual protein–guide combinations in Mammalian Cell Culture and Transfection and Mammalian Genome Editing. RNA was extracted after 5 days unless otherwise specified using an RNeasy 96 Plus kit (Qiagen) and reverse transcribed using a RevertAid First Strand cDNA Synthesis Kit (Thermo Fisher Scientific) using random hexamer primers as previously described52. RNA expression was measured by qPCR using commercially available TaqMan probes (Thermo Fisher Scientific) on a LightCycler 480 II (Roche) with GAPDH as an endogenous internal control in 5-μl multiplexed reactions. Each of the four biological replicates is the average of four technical qPCR replicates, and relative expression was calculated using the double delta Ct (ddCt) method53 with a negative control condition (average of all nontargeting replicates) consisting of the corresponding OMEGAoff or CRISPRoffv2.1 expression plasmid co-transfected with an AAVS1 targeting guide and GAPDH as the endogenous control. Statistical significance was assessed using a two-tailed t-test. All qPCR quantification data are available in Supplementary Table 7.
For gene activation experiments, we transfected 133 ng dOrufIscB-KRK–VPR of dCas9–VPR plasmids with 66-ng guide plasmids into 96-well plates of HEK293FT cells. RNA was extracted 5 days after transfection, then reverse transcribed and measured by qCPR as discussed above.
Western blot of PCSK9 protein after OMEGAoff repression
To perform a western blot to detect PCSK9 protein levels in AML12 cells after AAV transduction, cells were plated 16–20 h before infection to ensure 90% confluency at the time of transduction. For 12-well plates to be infected, cells were plated at 200,000 cells per well. Different AAV amounts (5 μl, 10 μl, 20 μl and 40 μl) were added. Then, the cells were transferred into 6-well plates after 2 days and collected 7 days after infection as follows. For each well, cells were washed with cold PBS and incubated for 30 min with 300 μl cold RIPA lysis buffer (Thermo Fisher Scientific) containing 3 μl Halt Protease Inhibitor Cocktail (Thermo Fisher Scientific) and 3 μl 0.5 M EDTA (Thermo Fisher Scientific). Samples were then prepared using LDS sample buffer (Thermo Fisher Scientific) and run on a 4–12% Bolt Bis–Tris gel (Thermo Fisher Scientific) in MOPS buffer for 30 min at 200 V. Membrane transfer was performed using iBlot2 Transfer Stacks (Thermo Fisher Scientific) on an iBlot2 machine for 7 min at 20 V. The membrane was blocked for 1 h at room temperature in 5% nonfat dry milk in TBS with 0.05% Tween-20 (TBS-T) buffer, then incubated with 1:1,000 Anti-PCSK9 antibody (Abcam, ab185194) and 1:10,000 Monoclonal Anti-β-Actin antibody (Sigma-Aldrich, A2228) in 2% nonfat dry milk in TBS-T buffer overnight. The membrane was then washed 5× in TBS-T buffer for 5 min each at room temperature, then incubated for an additional 2 h with secondary antibodies (Cell Signaling Technology, 7074S and 7076P2) at a 1:20,000 dilution in 2% nonfat dry milk in TBS-T buffer. The membrane was then washed an additional 3× as above and imaged on a BioRad Chemidoc imager.
RNA-seq
HEK293FT cells were transfected with OMEGAoff or CRISPRoff with nontargeting guides, CLTA-targeting guides and CALD1-targeting guides in 12-well plates. A total amount of 1.8 μg of plasmids was transfected per well including 1.2 μg OMEGAoff or CRISPRoff plasmid and 0.6 μg guide RNA plasmid. Total RNA was extracted using a Direct-zol RNA MiniPrep (Zymo) kit 14 days after transfection. The TruSeq Stranded mRNA Library Preparation Kit (Illumina) was used to prepare RNA-seq library samples starting with 1,000 ng RNA for each sample as per the manufacturer’s protocol. The library was quantified using a Qubit dsDNA HS Assay Kit (Thermo Fisher Scientific) and KAPA Library Quantification Kit (Roche). The final library was sequenced with read 1 50 cycles, index 1 6 cycles and index 2 6 cycles on an Illumina NextSeq. Spliced Transcripts Alignment to a Reference (STAR)54,55 was used to align the sequencing reads to the human genome (GRCh37), and Salmon54 was used to calculate the normalized transcripts per million (TPM) of each transcript. The transcripts whose TPM values were 0 in any one replicate and those showing more than twofold of difference between the two replicates were filtered out. The differentially expressed genes were identified using DESeq2 (ref. 56) by the comparison of CLTA-targeting or CALD1-targeting samples to nontargeting samples. The differential expressed transcripts (−log10(P value) > 5.5, log2(fold change) < −1 or >1) were labeled. The significant P value was determined by Bonferroni correction.
AAV production
For AAV viral production, HEK293FT cells were used and maintained as described in Mammalian Cell Culture and Transfection. Five 15-cm plates were used per virus prep. For each prep, 60 μg adenoviral helper plasmid, 50 μg pAAV8 serotype packaging (AAV2/8) plasmid and 30 μg transgene plasmid carrying both ωRNA and OMEGAoff protein construct were added to 5 ml OptiMEM with 500 μl 1 mg ml−1 PEI max solution (Polysciences). After mixing by vortexing, the mixture was incubated at room temperature for 5–10 min. Then, 1 ml of the transfection mixture was added to each plate dropwise immediately after mixing by pipetting to ensure distribution across the plates. Subsequently, 4 days after transfection, media were collected by PEG precipitation to isolate the particles as follows. Briefly, a solution containing 40% PEG 8000 (Promega) and 2.5 M NaCl was added into the medium at a ratio of 1:4. The mixture was incubated on ice for at least 2 h on a rocker, then centrifuged at 3,000 × g for 30 min. The large white pellet was then suspended in PBS and treated with 50 μl 100 mM MgCl2 and 50 μl 10 mg ml−1 DNAse for 60 min incubation at 37 °C. The solution was then subjected to an iodixanol gradient, and the virus-containing fractions were identified by qPCR and combined. Zeba Spin Desalting columns (Thermo Fisher Scientific) were used to purify and concentrate the viral particles. The titers of AAVs were determined by qPCR using ITR (inverted terminal repeat) primers (F: 5′-AACATGCTACGCAGAGAGGGAGTGG-3′, R: 5′-CATGAGACAAGGAACCCCTAGTGATGGAG-3′) with Roche Lightcycler 480.
In vivo experiments
All mice used for in vivo experiments were maintained at the vivarium facility of the Broad Institute with a standard diet, light cycles, temperature and humidity conditions. All the experiments were conducted on 5–6-week-old male C57/BL6 mice (The Jackson Laboratory) following IACUC (Institutional Animal Care and Use Committee)-approved protocols. The animals were made to fast for 12 h, and blood was collected through saphenous vein bleeds to measure the serum PCSK9 and total cholesterol levels. Each time, no more than 100 μl blood was collected. Twice, blood collection was performed before injection to evaluate pre-injection PCSK9 and cholesterol levels. After injection, blood collection was conducted once a week starting from 2 weeks postinjection. The AAV vectors, including Rosa26 targeting and two Pcsk9-targeting ωRNAs, were intravitreally injected into mice at a dosage of 2 × 10¹¹ total viral particles per animal. The injected volume was adjusted to 100 μl with sterile PBS. A PBS injection was included as a negative control. Five mice were injected for each condition. The animals were randomly chosen for each condition. To measure serum PCSK9 and cholesterol, blood samples were centrifuged at 2,000 × g for 15 min. The serum was then separated and stored at −20 °C for subsequent analysis. Serum PCSK9 levels were measured by ELISA using the Mouse Proprotein Convertase 9/PCSK9 Quantikine ELISA Kit (R&D Systems) using a 200-fold dilution as per the manufacturer’s instructions. Total cholesterol levels were measured using an Amplex Red Cholesterol Assay Kit (Thermo Fisher Scientific) following the manufacturer’s instructions. For liver function tests, the serum total bilirubin and ALT levels at the 24-week (6-month) time point were measured using a Bilirubin Assay Kit (Sigma-Aldrich) and an ALT Activity Assay Kit (Sigma-Aldrich) following the manufacturer’s instructions. All the assays were performed by BioTek Synergy Neo2 multi-mode reader (Thermo Fisher Scientific).
Cryo-EM sample preparation and data collection
The purified OrufIscB-REC–swap 49–ωRNA RNP complexes were loaded onto a Superose 6 Increase 10/300 column (Cytiva) equilibrated with a buffer containing 20 mM HEPES (pH 7.5), 150 mM NaCl, 2 mM MgCl2 and 4.5 mM TCEP. The fractions of RNP were pooled and concentrated to 5 mg ml−1 using Amicon Ultra-15 Centrifugal Filter Unit (50 kDa nominal molecular weight limit, Millipore UFC905024). To reconstitute the ternary complex, the RNP was mixed with double-strand target DNA, which was formed by the annealing of two DNA oligos encoding the target sequence, and incubated at 37 °C for 30 min. Then, 3 μl of ternary complex was applied onto glow-discharged CryoMatrix R1.2/1.3 300-mesh gold holey grids with amorphous alloy film (Zhenjiang Lehua Technology). The grids were blotted for 3 s under 100% humidity at 4 °C and then vitrified by plunging into liquid ethane using a Vitrobot Mark IV (Thermo Fisher Scientific).
The prepared grids were transferred to the EF-Krios (Thermo Fisher Scientific) operating at 300 kV with a GatanK3 imaging system and the data collected at 105,000× nominal magnification. The calibrated pixel size of 0.4125 Å was used for processing. Zero-loss images were taken using an energy filter slit width of 20 eV. Videos were collected using Leginon 3.6 (ref. 57). Data were collected at a dose rate of 27.12 e− Å−2 s−1 with a total exposure of 1.80 s, resulting in an accumulated dose of 48.82 e− Å−2. Intermediate frames were recorded every 0.05 s for a total of 40 frames per micrograph. A total of 7,580 images were collected at a nominal defocus range of 0.7–2.4 μm. Ice thickness was determined as described in refs. 58,59.
Cryo-EM data processing and model building
Image processing was performed on CryoSPARC v4.2.0 (ref. 60) and RELION 4.0 (ref. 61). Image stacks were subjected to beam-induced motion correction using MotionCor2.0 (ref. 62). Contrast transfer function parameters for each nondose-weighted micrograph were determined by CTFFIND4 (ref. 63). On-the-fly particle picking was done by Warp64. Automated particle picking yielded 2,701,471 particles, which were extracted on a binned dataset with a pixel size of 1.65 Å and were subjected to reference-free two-dimensional classification and 8 rounds of heterogeneous refinement, producing 258,164 particles with well-defined structural features of a ternary complex. These particles were re-extracted with a pixel size of 0.825 Å and subjected to nonuniform refinement65, which generated a map with an indicated global resolution of 2.58 Å at a Fourier shell correlation of 0.143. The particles were subjected to three-dimensional classification, a subset with 68,817 particles showing features of the inserted REC domain, an extended guide–DNA heteroduplex and an HNH domain. These particles were then subjected to nonuniform refinement, generating a map with an indicated global resolution of 2.71 Å at a Fourier shell correlation of 0.143.
Protein models predicted by AlphaFold2 (refs. 27,46) and an ωRNA model of OrufIscB–ωRNA–target DNA complex (Protein Data Bank: 7XHT) were used as initial models. The models were docked into the cryo-EM density maps using ChimeraX 1.7 (ref. 66), followed by iterative manual adjustment and rebuilding in ISOLDE67 and Coot 0.8.9 (ref. 68), against the cryo-EM density. Real space refinements were performed using PHENIX 1.18 (ref. 69). The model statistics were validated using MolProbity 4.5 (ref. 70). The refinement statistics are provided in Supplementary Table 6. Structural figures were prepared in ChimeraX 1.7.
Selection and in silico testing of REC swaps
AlphaFold2 was used to create protein structural models of representative IscBs and type II-D Cas9s. Structures were then aligned along the bridge helix and RuvC-II region using PyMol’s super align algorithm to identify regions of homology that may exist near REC insertions. Additional type II-D Cas9 and IscB sequences were retrieved using an HMM search (HMMER) against all protein coding sequences (clustered at 100% sequence identity using MMSeqs2) from the genomic or metagenomic database as described in a previous study28. Using MAFFT, the retrieved IscBs and early type II-D Cas9s were aligned, and all regions with REC-like insertions between the bridge helix and RuvC-II domains were selected. The regions corresponding to the structurally homologous regions were then identified and checked for sequence conservation. The positions of conserved residues near the bridge helix and the RuvC-II were used as anchor positions for recombining sequences. Proteins without homologous sequences at the anchor positions were not considered for REC swaps. REC insertions from other orthologs were then swapped into the OrufIscB ortholog by switching the region between the conserved residues. For a select set of divergent Cas9s with crystal structures, structural homology alone was used to select potential REC swaps with anchor points in similar regions as described above. However, because most Cas9s outside of type II-D do not have the conserved charged motif found after the bridge helix in most IscBs, the RECs in these cases were truncated at the N-terminus in a structurally similar location to maintain the overall folding of the REC domain. AlphaFold2 models of OrufIscB along with swapped REC domains were performed as described above for the native orthologs.
The sequence conservation Shannon information mapping was performed as follows. All type II-D Cas9s with REC domains were aligned using MAFFT along with a panel of IscBs, including OrufIscB. This alignment was then trimmed to match the REC domain boundaries of Nba-1 REC, which was then set as a reference for the alignment. For each position in the reference sequence of Nba-1 REC, the distribution of nongap sequences was determined, and the Shannon information was calculated for this distribution (using log base 2). High Shannon information positions indicate high conservation in the structure and were used to determine conserved residues for REC loop swaps for regions 1, 2 and 3. For each region (1, 2 and 3), swaps were created by exchanging the OrufIscB sequence within the conserved flanking residues with sequences from another REC ortholog, based on the multiple sequence alignment.
For Fig. 2a, AlphaFold3 (ref. 71) was used to generate a full RNP prediction with target DNA, nontarget DNA, RNA and protein. However, due to the low quality of the RNA prediction, only the guide portion of the RNA was shown. AlphaFold3 (ref. 71) models were generated for the WT OrufIscB system, OrufIscB-REC system and NovaIscB system.
RNA model
The secondary structure model of the OrufIscB ωRNA was generated by the RNAstructure webserver72 on the OrufIscB ωRNA scaffold. The prediction contained a spurious set of two base pairs between 69 and 141 as well as 70 and 140, which were removed, as positions 69 and 70 are thought to separate the adaptor hairpin and the large pseudoknot stemloop and are thus unlikely to form additional stemloop contacts in the structure.
Calculating the distribution of potential guides of OrufIscB within 500 bp of transcription start sites
Human transcription factor start sites were downloaded from refTSS_v4 (ref. 73) and mapped onto the human genome (version GRCh38.110). As refTSS_v4 may contain multiple transcription start sites for the same mRNA or gene, only transcription start sites up to 100 bp into the predicted mRNA start site or upstream from the predicted mRNA start site were selected. Of these remaining transcription start sites, the one selected to correspond to a specific gene was the one with the closest distance to the gene. These resulting transcription start sites formed the processed refTSS_v4 dataset. Coding sequences (CDSs) were identified within each genomic chromosome (ignoring the mitochondrial genome) based on the GenBank annotation, along with its corresponding predicted mRNA. For each gene’s mRNA, the standard gene name was used to cross-reference with the refTSS_v4 database to identify the transcription start site, using the predicted mRNA start site from the human genome GenBank file as the default transcription start site if there was no corresponding entry in the processed refTSS_v4. For each gene with a CDS, a ±500 bp window was formed around the transcription start site and searched for NTAAA or TTTAN (reverse complement of NTAAA) sequences to identify the number of potential guides and target sites within a 500-bp window around the transcription start site. The distribution of the number of potential guides (within 500 bp of the transcription start site) was then calculated across all CDS-containing genes.
The same approach was used as above for calculating the number of genes available for NovaIscB for knockout (KO). This was done by taking each gene’s genome-mapped coding sequence segments and counting the number of TAM sites that would enable the guide to have position 10 of the guide inside the coding sequence. Position 10 was used as this results in guides in which the cleavage site will be located inside the CDS. The distribution of the number of theoretical guides that could target a given gene was then calculated across all CDSs.
Reporting summary
Further information on research design is available in the Nature Portfolio Reporting Summary linked to this article.