

Optimized DMNB-T6P synthesis
General chemical materials and methods
All reagents were purchased from commercial sources and were used without further purification unless noted. Molecular sieve (4 Å, powder) used in reactions was activated at 350 °C for more than 12 h. Dry solvents for reactions were purchased from Sigma-Aldrich; the following abbreviations are used: PE, petroleum ether (boiling point (bp) 40–60 °C); EtOAc, ethyl acetate; THF, tetrahydrofuran. Thin layer chromatography (TLC) was carried out using Merck aluminium-backed sheets coated with Kieselgel 60-F254 silica gel. Visualization of the reaction components was achieved using UV fluorescence (254 nm) and/or by charring with an acidified p-anisaldehyde solution in ethanol. Organic solvents were evaporated under reduced pressure, and the products were purified by flash column chromatography on silica gel (230–400 mesh). Proton nuclear magnetic resonance (1H NMR) spectra were recorded on Bruker AVG400, AVH400 or AVB400 (400 MHz) spectrometers, and the chemical shifts are referenced to residual CHCl3 (7.26 ppm, CDCl3), CHD2OD (3.30 ppm, CD3OD) and C6HD5 (7.16 ppm, C6D6). Carbon nuclear magnetic resonance (13C NMR) spectra were recorded on Bruker AVG400 (100 MHz) spectrometers and are proton decoupled, and the chemical shifts are referenced to CDCl3 (77.0 ppm) or CD3OD (49.0 ppm). Assignments of NMR spectra were based on two-dimensional experiments (1H-1H COSY, DEPT-135, HSQC and HMBC) if required. Chemical shift for 31P NMR is reported with reference to phosphoric acid (0.00 ppm). Reported splitting patterns are abbreviated as follows: s, singlet; d, doublet; t, triplet; q, quartet; p, pentet; hept, heptet; m, multiplet; br, broad. Low-resolution mass spectra (LRMS) were recorded on a Micromass Platform 1 spectrometer using electrospray ionization (ESI) or on a Bruker Daltronic MicroTOF spectrometer. High-resolution mass spectra (HRMS) were recorded on a Bruker Daltronic MicroTOF spectrometer using ESI (m/z values are reported in Daltons). Optical rotations were measured on a PerkinElmer 241 polarimeter at 589 nm (Na D-line) with a path length of 1.0 dm at ambient temperature and are in units of degree ml g−1 dm−1. Infrared spectra were recorded on a Bruker Tensor 27 Fourier Transform spectrophotometer using attenuated total reflectance (ATR), and absorption maxima (ν max) are reported in wavenumbers (cm−1). X-ray powder diffraction was recorded on a PANalytical Empyrean Series 2 powder diffractometer.
Preparation of K2CO3 solution for deprotection under anhydrous conditions
Anhydrous K2CO3 (solid, 50 mg, 0.1% (w/v) to methanol) was added into dry methanol (50 ml) under inert condition, and the mixture was stirred at room temperature for 30 min, followed by the addition of dry CH2Cl2 (10 ml, 20% (v/v) to methanol). The resulting solution was used directly for selective deprotection of 1 (2 g) at cold temperature without filtration. Concentration proves important to selectivity, and dosage must be increased proportionally for large-scale reactions.
2,3,4,6,2′,3′,4′,6′-Octakis-O-(trimethylsilyl)-d-trehalose (1)
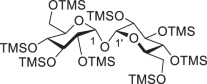
Under inert atmosphere (argon), to a stirred solution of d-(+)-trehalose dihydrate (25.00 g, 66.08 mmol) in dry pyridine (250 ml) were added chlorotrimethylsilane (100.64 ml, 792.96 mmol) and hexamethyldisilazane (110.23 ml, 528.64 mmol) successively at cold temperature (ice water mixture, 2–4 °C), and the resulting mixture was allowed to warm to room temperature. After stirring for 6 h, the thick solution was concentrated under vacuum, and the crude residue was suspended in CH2Cl2 (300 ml) and washed with saturated NaCl (aq.) solution (300 ml). The organic layer was separated; the aqueous layer was extracted with CH2Cl2 (150 ml × 3); and the combined organic layers were dried over Na2SO4, filtered and concentrated and dried in vacuum to give the desired compound 1 (60.75 g, quant.) as an amorphous white solid: Rf = 0.68 (PE–EtOAc, 20:1); melting point (mp) 81–82 °C; [α]D25 + 96.9 (c 1.0, CH2Cl2); literature (lit.) mp 80–82 °C; [α]D25 + 94 (c 1.5, CHCl3); 1H NMR (400 MHz, CDCl3): δ 4.91 (d, J1,2 = 3.1 Hz, J1′,2′ = 3.1 Hz, 2H, H-1, H-1′), 3.88 (t, J = 9.0 Hz, 2H), 3.78 (ddd, J = 9.4 Hz, J = 4.0 Hz, J = 2.4 Hz, 2H), 3.69 (dd, J = 11.3 Hz, J = 2.4 Hz, 2H), 3.65 (dd, J = 11.3 Hz, J = 4.0 Hz, 2H), 3.43 (t, J = 9.0 Hz, 2H), 3.38 (dd, J = 9.4 Hz, J = 3.1 Hz, 2H), 0.139 (s, 18H), 0.135 (s, 18H), 0.11 (s, 18H), 0.09 (s, 18H) ppm.
2,3,4,2′,3′,4′,6′-Heptakis-O-(trimethylsilyl)-d-trehalose (2a) and 2,3,4,2′,3′,4′-hexakis-O-(trimethylsilyl)-d-trehalose (2b)
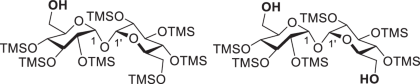
Potassium carbonate (165 mg, 1.19 mmol) was added into methanol (165 ml, high-performance liquid chromatography (HPLC) grade, 5.5 ml g−1); the resulting suspension was stirred at room temperature for 30 min, and then CH2Cl2 (33 ml, HPLC grade, 1.1 ml g−1) was added, followed by the addition of the substrate 1 (30 g, 32.62 mmol, ground, white powder) in one portion. After stirring for 2 h at room temperature, the clear solution was quenched by acetic acid (136.7 μl, 2.39 mmol) and pyridine (193 μl, 2.39 mmol) successively. After removal of the solvent under vacuum, the crude residue was then suspended in CH2Cl2 (200 ml) and washed with saturated NaCl solution (200 ml), and the organic layer was separated; the aqueous layer was extracted with CH2Cl2 (50 ml × 3); and the combined organic layers were dried over Na2SO4, filtered and concentrated and dried under high vacuum overnight, giving a mixture of 2a and 2b (25.7 g, quant., 2a:2b = 1:4) as a white foam, which was used directly in the phosphorylation.
2a when isolated is a colorless syrup: Rf = 0.21 (PE–EtOAc, 20:1); [α]D25 + 96.4 (c 1.0, CH2Cl2); lit. [α]D25 + 113 (c 2.5, PE); 1H NMR (400 MHz, CDCl3): δ 4.93 (d, J1′,2′ = 3.1 Hz, 1H, H-1′), 4.88 (d, J1,2 = 3.1 Hz, 1H, H-1), 3.91–3.82 (m, 3H), 3.79 (ddd, J = 9.4 Hz, J = 4.6 Hz, J = 2.0 Hz, 1H), 3.74–3.63 (m, 4H), 3.48–3.38 (m, 4H), 1.75 (br s, 1H), 0.16 (s, 9H), 0.140 (s, 9H), 0.138 (s, 18H), 0.12 (s, 9H), 0.11 (s, 9H), 0.10 (s, 9H) ppm.
2b when isolated is an amorphous white solid: Rf = 0.48 (PE–EtOAc, 3:1); mp 115–116 °C; [α]D25 + 99.8 (c 1.0, CH2Cl2); lit. mp 114–115 °C; [α]D22 + 99.5 (c 2.7, CHCl3); 1H NMR (400 MHz, CDCl3): δ 4.90 (d, J1,2 = 3.1 Hz, J1′,2′ = 3.1 Hz, 2H, H-1, H-1′), 3.89 (t, J = 9.0 Hz, 2H), 3.85 (dt, J = 9.5 Hz, J = 3.2 Hz, 2H), 3.74–3.66 (m, 4H), 3.48 (t, J = 9.1 Hz, 2H), 3.42 (dd, J = 9.3 Hz, J = 3.1 Hz, 2H), 1.73 (br s, 2H), 0.16 (s, 18H), 0.14 (s, 18H), 0.12 (s, 18H) ppm.
Synthesis of 4,5-dimethoxy-2-nitrobenzaldehyde (3)
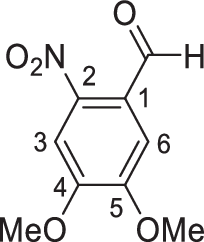
Nitric acid (100 ml, 70%) was cooled by an ice water bath (2–4 °C) for 30 min; veratraldehyde (20 g, 120.35 mmol, ground) was added portion-wise with stirring; and the mixture was brought to 10 °C and stirred until a clear solution was obtained (around 1 h). Then, the mixture was poured into an ice water mixture (1,000 ml) while stirring vigorously. The resultant yellow solid was collected by filtration and washed with cold water to remove nitric acid completely, and the solid was recrystallized from boiling ethanol (300 ml), affording 3 (20 g, 79%) in the form of yellow needle crystals: Rf = 0.56 (PE–EtOAc, 3:1); mp 131–132 °C; 1H NMR (400 MHz, CDCl3): δ 10.45 (s, 1H, CHO), 7.62 (s, 1H, H-3), 7.42 (s, 1H, H-6), 4.04 (s, 3H, OCH3), 4.03 (s, 3H, OCH3) ppm.
4,5-Dimethoxy-2-nitrobenzyl alcohol (4)
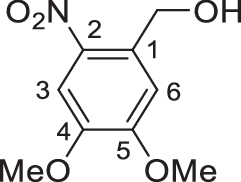
Sodium borohydride (3.8 g, 100.6 mmol) was added to an ice-cooled solution of 4,5-dimethoxy-2-nitrobenzaldehyde (3) (17.7 g, 83.8 mmol) in anhydrous tetrahydrofuran (THF) (400 ml), and the mixture was stirred at 2–4 °C for 3 h. The reaction was quenched by addition of water (400 ml); the organic layer was separated; and the aqueous layer was extracted with CH2Cl2 (150 ml × 3). Then, the combined organic layers were dried over anhydrous Na2SO4 and filtered and concentrated to dryness to give alcohol 4 (17.8 g, quant.) as an amorphous yellow solid: Rf = 0.24 (PE–EtOAc, 3:1); mp 151–152 °C; 1H NMR (400 MHz, CDCl3): δ 7.71 (s, 1H, H-3), 7.18 (s, 1H, H-6), 4.96 (d, J = 6.5 Hz, 2H, ArCH2OH), 4.01 (s, 3H, OCH3), 3.96 (s, 3H, OCH3), 2.60 (t, J = 6.5 Hz, 1H, OH) ppm.
Bis-(4,5-dimethoxy-2-nitrobenzyl)-N,N-diisopropylphosphoramidite (6)
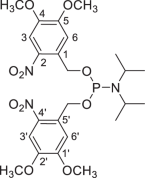
Under inert atmosphere (argon), to a stirred solution of phosphorus trichloride (13.09 ml, 150 mmol) in dry THF (400 ml) were added diisopropylethylamine (52.25 ml, 300 mmol) and diisopropylamine (42.05 ml, 300 mmol) successively at cold temperature (ice water bath, 2–4 °C). After stirring for 4 h at the same temperature, the suspended solution was cooled to −15 °C. Then, triethylamine (46.00 ml, 330 mmol) and 4,5-dimethoxy-2-nitrobenzyl alcohol (4) (64.0 g, 300 mmol) were added successively. The resulting mixture was allowed to warm to room temperature and stirred for a further 20 h in the dark. Saturated NaHCO3 (aq.) solution (200 ml) was added, and the resulting suspension was filtered, washed with water (50 ml × 2) and CH3CN (50 ml × 2) and completely dried under vacuum to give the desired phosphoramidite 6 (73.5 g, 88%) as an amorphous yellow solid: Rf = 0.43 (PE–EtOAc, 3:1); mp 142–143 °C (melts and decomposes); 1H NMR (400 MHz, CDCl3): δ 7.63 (s, 2H, H-3, H-3′), 7.30 (s, 2H, H-6, H-6′), 5.150 (dd, J = 16.4 Hz, J = 6.9 Hz, 1H, ArCH2O), 5.149 (dd, J = 16.4 Hz, J = 6.9 Hz, 1H, ArCH2O), 5.061 (dd, J = 16.4 Hz, J = 6.9 Hz, 1H, ArCH2O), 5.059 (dd, J = 16.4 Hz, J = 6.9 Hz, 1H, ArCH2O), 3.87 (s, 6H, OCH3 × 2), 3.86 (s, 6H, OCH3 × 2), 3.73–3.64 (m, 2H, NCH(CH3)2 × 2), 1.19 (d, J = 6.8 Hz, 12H, NCH(CH3)2 × 2) ppm; 13C NMR (100 MHz, CDCl3): δ 153.9 (C-5, C-5′), 147.6 (C-4, C-4′), 138.8 (C-2, C-2′), 131.74, 131.66 (C-3, C-3′), 109.4 (C-1, C-1′), 107.9 (C-6, C-6′), 62.6 (ArCH2O), 62.4 (ArCH2O), 56.39 (OCH3 × 2), 56.35 (OCH3 × 2), 43.5 (NCH(CH3)2), 43.4 (NCH(CH3)2), 24.8 (NCH(CH3)2); 24.7 (NCH(CH3)2) ppm; 31P NMR (162 MHz, CDCl3): δ + 147.41 ppm.
6-O-Bis-(4,5-dimethoxy-2-nitrobenzyloxyphosphoryl)-d-trehalose (DMNB-T6P)
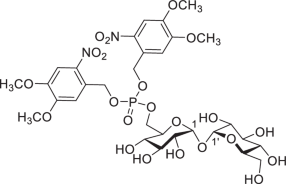
Potassium carbonate (165 mg, 1.19 mmol) was added into methanol (165 ml, HPLC grade, 5.5 ml g−1), and the resulting suspension was stirred at room temperature for 30 min. Then, CH2Cl2 (33 ml, HPLC grade, 1.1 ml g−1) was added, followed by the addition of the substrate 1 (30 g, 32.62 mmol) in one portion. After stirring for 2 h at room temperature, the clear solution was quenched by acetic acid (136.7 μl, 2.39 mmol) and pyridine (193 μl, 2.39 mmol) successively. After removal of the solvent under vacuum, the crude residue was then suspended in CH2Cl2 (200 ml) and washed with saturated NaCl solution (200 ml). The organic layer was separated; the aqueous layer was extracted with CH2Cl2 (50 ml × 3); and the combined organic layers were dried over Na2SO4, filtered and concentrated and dried under high vacuum overnight, giving a mixture of 2a and 2b as a white foam, which was used directly in the phosphorylation. Under inert environment (argon), a mixture of the residue from above and molecule sieve (32.6 g, 4 Å MS, powder, 100 mg ml−1) in dry CH2Cl2 (326 ml, 10 ml mmol−1) was stirred for 30 min at room temperature, and then 5-phenyl-1H-tetrazole (10.0 g, 68.50 mmol, 2.10 eq.) was added, followed by the addition of phosphoramidite 6 (19.0 g, 34.25 mmol, 1.05 eq.) in five portions over 2.5 h. After stirring for 30 min at room temperature, the solution was cooled to −78 °C, and meta-chloroperbenzoic acid (8.85 g, 35.88 mmol, 1.1 eq., ~70%) was added slowly, and the resulting mixture was allowed to warm to room temperature and was stirred for 30 min. Then, the reaction was quenched by dimethyl sulfide (479 μl, 6.52 mmol, 0.2 eq.) slowly. After stirring for 30 min, the mixture was filtered, and the filtrate was concentrated under vacuum and purified by flash column chromatography (PE–EtOAc, 1:1) to give a mixture of the trimethylsilyl (TMS)-protected intermediates as a white foam. The resulting foam was dissolved in CH2Cl2 (652 ml, HPLC grade, 20 ml mmol−1), and trifluoroacetic acid (32.6 ml, 5%, v/v) was added. After stirring for 30 min at room temperature, the reaction solution was completely concentrated under vacuum, giving a yellow foam (around 17 g). Recrystallization: methanol (100 ml) was added, and the suspension was heated to 55 °C to facilitate a clear solution and then cooled to room temperature slowly. After repeating this ‘heating–cooling’ operation three times, yellow powder appeared. After that, it was left at 4 °C overnight, and the yellow solid was collected by filtration, giving the desired product DMNB-T6P (13.3 g, 50%) as an amorphous yellow powder that was then recrystallized to give a yellow solid: Rf = 0.23 (EtOAc–CH3OH, 2:1; or EtOAc–CH3OH, 3:1, plus 0.1% of formic acid (v/v)); mp 124–125 °C (melts and decomposes); [α]D25 + 63.2 (c 1.0, CH3OH); 1H NMR (400 MHz, CD3OD): δ 7.63 (d, Jp = 0.8 Hz, 2H, ArH), 7.13 (s, 2H, ArH), 5.48–5.44 (m, 4H, ArCH2O × 2), 5.04 (d, J1,2 = 3.7 Hz, 1H, H-1), 5.00 (d, J1′,2′ = 3.7 Hz, 1H, H-1′), 4.42–4.32 (m, 2H, H-6a, H-6b), 4.05–4.01 (m, 1H, H-5), 3.91 (s, 6H, OCH3 × 2), 3.88 (s, 6H, OCH3 × 2), 3.82–3.72 (m, 4H, H-5′, H-6′a, H-3, H-3′), 3.66 (dd, J6′b,6′a = 12.0 Hz, J6′b,5′ = 5.3 Hz, 1H, H-6′b), 3.44 (dd, J2,3 = 8.2 Hz, J2,1 = 3.7 Hz, 1H, H-2), 3.41 (dd, J2′,3′ = 8.2 Hz, J2′,1′ = 3.7 Hz, 1H, H-2′), 3.34 (dd, J4,3 = 9.9 Hz, J4,5 = 9.0 Hz, 1H, H-4), 3.30 (t, J4′,3′ = 9.5 Hz, J4′,5′ = 9.5 Hz, 1H, H-4′H) ppm; 13C NMR (100 MHz, CD3OD) δ 155.2 (qCAr), 150.0 (qCAr), 140.8 (qCAr), 140.7 (qCAr), 127.73 (d, 3JP,C = 6.6 Hz, qCAr), 127.66 (d, 3JP,C = 6.6 Hz, qCAr), 111.6 (ArC), 111.5 (ArC), 109.3 (ArC), 95.34 (C-1), 95.27 (C-1′), 74.6 (C-3), 74.4 (C-3′), 73.9 (C-5′), 73.15 (C-2), 73.06 (C-2′), 72.0 (d, 3JP,C5 = 6.4 Hz, C-5), 71.9 (C-4), 71.2 (C-4′), 68.8 (d, 2JP,C6 = 5.7 Hz, C-6), 67.91 (d, 2JP,C = 4.4 Hz, ArCH2O), 67.88 (d, 2JP,C = 4.4 Hz, ArCH2O), 62.6 (C-6′), 57.0 (OCH3), 56.8 (OCH3) ppm; high-resolution mass spectrometry (HRMS) (ESI): m/z was calculated for C30H41O22N2NaP [M+Na]+ 835.1781. Found: 835.1772.
DMNB-T6P treatment
DMNB-T6P was dissolved in DMSO with Tween 20 as adjuvant (Supplementary Table 1) fresh for delivery to the crop using a backpack CO2 sprayer with flat fan type nozzle at a flow of 200 L per hectare, covering the whole plot.
Field trial at CIMMYT, Mexico
Seeds were sown at the CIMMYTʼs Campo Experimental Norman E. Borlaug (CENEB) outside of Ciudad Obregon, Sonora, Mexico (27.372035, −109.924919). The soil type at the experimental station is a coarse sandy clay, mixed montmorillonitic typic caliciorthid, low in organic matter and slightly alkaline (pH 7.7)59. Appropriate weed disease and pest control were implemented to avoid yield limitations. Plots were fertilized with 50 kg N per hectare (urea) and 50 kg P per hectare at soil preparation, 50 kg N per hectare with the first irrigation and another 150 kg N per hectare with the second irrigation. Four high-yielding, modern, semi-dwarf, spring wheat genotypes were grown: BACANORA T 88, KAUZ*2/MNV//KAUZ, KAMBARA2 and BORLAUG100 F2014. The plants were sown on 16 December 2021 in a randomized split plot design with DMNB-T6P treatments applied to main plots and cultivars randomized to subplots. Each plot consisted of two beds with two rows, 3.5 m in length. Dose was varied by concentration; four DMNB-T6P treatments were applied in the field: the control (0 T6P), 0.5 mM, 1 mM and 2 mM DMNB-T6P in the volume per m2 equivalent to dose 2 adjusted for the sprayed area (Supplementary Table 1). Preparation of the T6P solution was as previously described23 and as for the field trials in Argentina. The DMNB-T6P solution was applied once to the canopy of the wheat crop in the late afternoon at 10 DAA.
The field trial was harvested on 31 May 2022, after reaching full maturity. Yield components were evaluated following the CIMMYT Wheat Physiology Handbook60. Fifty tillers were harvested at random per plot and then brought to the field station at CENEB for further processing. After harvesting the tillers, the spikes were removed from the stems and dried in an oven until reaching a dry constant weight. Seeds were then threshed and used to calculate thousand grain weight (TGW) and grain number (GN). Border plants were excluded from both the final and yield component harvests to minimize border effects between genotypes and treatments.
LEF was measured using a MultispeQ 2.0 (PhotosynQ) and the pre-programmed RIDES protocol. No significant difference was observed between treatments for ambient photosynthetic photon flux density (PPFD) at the time of measurement, indicating that differences in light intensity are not a contributing factor to differences seen between genotypes or treatments (Extended Data Fig. 8). Measurements were made in the field between 10:30 and 14:30 on the wheat flag leaf 3 d after the foliar application of the DMNB-T6P solution. In total, six plants (n = 6) were measured per genotype and treatment. Six plots were measured per genotype and treatment (n = 6). Within the plot, two plants were measured.
Field trials in Argentina
Over four seasons (2018, 2020, 2021 and 2022), field trials were performed under rainfed conditions at the National Institute of Agricultural Research (INTA) Oliveros Research Station, Santa Fe, Argentina (32° 3′ S, 60° 51′ W), in an argiudoll soil with more than 50 years of agricultural history61. High-yielding commercial Argentinian spring wheat bread-making varieties were chosen with 13–15% grain protein: Buck Saeta, DM Ceibo and MS INTA 415. Buck Saeta is Group 1, suitable for industrial baking. Ceibo is Group 2, suitable for traditional baking (more than 8 h of fermentation). MS INTA is Group 3, suitable for direct baking (less than 8 h of fermentation). No tillage conditions were used following soybean as the previous crop. Dose was varied by spray volume. DMNB-T6P was applied once at 1 mM in two or three separate doses (different volumes) (doses 1–3, at 220 ml, 438 ml or 656 ml per 7-m2 plot; Supplementary Table 1). Application was at 10 DAA in 2018, 2020 and 2022 and at 16 DAA in 2021 (due to late delivery of DMNB-T6P), applied in the morning. Calendar timings are shown in Supplementary Table 2. Treatments were arranged in a randomized complete block design with 4–6 replications. Each experimental unit was seven rows spaced 20 cm and 7 m long. The central five rows of each plot were sprayed, giving a spray area of 7 m2, of which 3 m2 (three central rows 0.6 m × 5 m long) was harvested for grain yield. Phosphorus, sulphur and nitrogen fertilization was performed using super triple phosphate (20% P), calcium sulphate (18% S) and urea, applied at planting at a rate of 100 kg per hectare. N fertilization was estimated by summing pre-plant soil N test as nitrates at 0–60-cm depth (PPNT) plus N added as fertilizer to reach 140 kg per hectare as urea–ammonium nitrate (32% N). N rates were 130, 119, 77 and 101 for years 1, 2, 3 and 4, respectively. Soil organic matter was 2.3% in year 1, 2.5% in year 2, 2.6% in year 3 and 1.9% in year 4, and pH was 5.5, 6.1, 5.9 and 5.8 in the 4 years, respectively.
Weather conditions during the wheat cycle
Cumulative rainfall from May (before crop planting and important for recharging the soil profile) to middle November (when physiological maturity was reached) was 544 mm, 119 mm, 290 mm and 130 mm in years 1, 2, 3 and 4, respectively (Extended Data Fig. 3). These values were 40% above, 70% below, 26% below and 67% below historical records. During the grain filling period (late October to early November), rainfall in years 1, 2, 3 and 4 averaged 125 mm, 58 mm, 74 mm and 39 mm, respectively (9% higher and 49%, 35% and 66% lower than historical records). Maximum and minimum temperature during the cycle ranged averaged from 22.0 °C to 23.7 °C and from 7.1 °C to 8.5 °C in the 4 years. During the grain filling period, maximum temperatures averaged 27.4 °C, and minimum temperatures averaged 12.2 °C. Maximum temperatures were 9% above historical values, and minimum temperatures were 6% below the historical records.
Protein determination
Protein was determined using a NIRS DS2500 analyzer (FOSS Analytical) and fitted to 14% moisture.
Data plotting and statistical analyses
Data are plotted as box plots (Figs. 2–4), which plot the data with medians but not the statistical tests. Statistical analysis of each Argentinian field trial was performed using a two-way factorial ANOVA accounting for the randomized complete block layout in R version 4.2.1. Additionally, a combined analysis over all 4 years was performed using a mixed model framework fitted using REML (Supplementary Table 3). The model consisted of variance components for both block and the blockplot residual separately for each year. Approximate (sequential) F statistics were calculated using Kenward–Roger degrees of freedom. Additionally, standard errors of the difference (SEDs) of the means are plotted as supplementary data (Extended Data Fig. 10). SEDs are shown for comparisons between pairs of overall T6P treatment means and for comparisons between pairs of means for combinations of genotype and T6P treatment based on 34, 24, 33 and 33 degrees of freedom for 2018, 2020, 2021 and 2022 experiments, respectively. Pairwise t-tests were conducted for Fig. 5ciii,d. Analysis of the Mexico field trial was conducted using multi-strata ANOVA to account for the split plot design. Models were fitted in Genstat 22nd edition. We avoid strict thresholding of P values and use of terms ‘significant’ and ‘non-significant’, as biological significance is best understood through examination of statistical tests and P values as a whole over the trialing period incorporating ANOVA analyses (Figs. 2–4) and combined analysis (Supplementary Table 3). We include P values lower than P < 0.1 and do not consider values higher than this. Although, of note, for acceptance as a new biostimulant in the European Union under regulations 2019/1009, such as DMNB-T6P, P < 0.15 values are required (European Document CEN/TS 17700-1:2022, ‘Plant Biostimulants – Claims – Part1: General Principles’ Annex A ‘P-value choice and impact on the results quality’).
Transcriptome analyses
Whole ears were sprayed 10 DAA with 1 mM DMNB-T6P on Cadenza wheat grown in a controlled environment as in ref. 23. The middle-third of each ear was frozen in liquid nitrogen and stored at −80 C. Whole grain tissue was ground to a fine powder under liquid nitrogen, and total RNA was extracted using the TRIzol method for four independent biological replicates per condition at time 0, 4 h and 24 h after treatment with DMNB-T6P. After RNA integrity analysis and quantitation (Agilent, Bioanalyzer), poly(A)-enriched cDNA libraries were generated and sequenced on an Illumina NovaSeq 6000 sequencing platform generating 30–50 million 150-bp paired-end reads per sample. Low-quality reads and adaptor sequences were removed with Trimmomatic (trimmomatic-0.39.jar PE ILLUMINACLIP:TruSeq3-PE.fa:2:30:10:2:True TRAILING:30 MINLEN:40)62. The reads were aligned to the wheat reference genome (Triticum aestivum iwgsc_refseqv2.1 (ref. 63)) using HISAT2/2.2.1-foss-2019b with default parameters64 and converted to BAM format with SAMtools65. Gene or transcript abundance was quantified using featureCounts66 with the High Confidence iwgsc_refseqv2.1 annotation (counting only primary alignments of read pairs with a quality cutoff of 10). The RNA-seq data were deposited under BioProject in the National Center for Biotechnology Information (NCBI) Sequence Read Archive (SRA) (Supplementary Table 5)67. Raw counts were normalized using the trimmed mean of M-values method by DESeq2 (ref. 67). Differentially expressed genes (DEGs) were identified based on DESeq2 3.15 with adjusted P value (Padj) < 0.05 and |log2 fold change (FC)| > 1 as selection criteria. Further statistical analyses and visualizations were conducted in R, and plots and heatmaps were created using the ggplot2 3.4.0, ComplexHeatmap 2.14.0 and tidyheatmap 1.10.0 packages in R68,69,70.
Microscopy
Whole grains were fixed in 4% paraformaldehyde with 2.5% glutaraldehyde, dehydrated in an ethanol series and embedded in LR White resin (TAAB Laboratories Equipment, Ltd.). Transverse sections of the medial region were imaged after staining with toluidine blue. All samples were imaged with a ×10 objective using an Axio Imager.Z2 (Zeiss). Sieve tube areas in the vascular bundle were manually traced and quantified with ImageJ71.
Gas exchange
Leaf gas exchange measurements of Cadenza wheat were made with a portable infrared open gas exchange system (LI-COR, LI-6400XT) under the following growing conditions: ambient CO2 (400 µl l–1), leaf temperature 22 °C, PPFD 500 µmol m−2 s−1 and relative air humidity 65 ± 5% with an air flow rate of 200 µmol s−1. The middle region of each flag leaf reached a steady state of CO2 uptake in the leaf chamber before measurements were taken. Data are of four measurements taken at 10 DAA (before treatment), 11 DAA, 12 DAA, 15 DAA and 20 DAA from four separate plants treated with 1 mM DMNB-T6P applied to the spike at 10 DAA after growing under previously described conditions23.
Treatment of sorghum with DMNB-T6P in controlled environment
Sweet sorghum seeds were grown in 30-cm pots containing Rothamsted compost23 under 28 °C/22 °C, 12-h day/night cycles, 500 µmol m−2 s−1 quanta and 60% relative humidity. Regular watering was continued throughout the experiment except for drought stress treatments where watering was reduced to 60% of pot weight at anthesis and maintained at that level of drought until harvest. Eight milliliters per spike of 2 mM DMNB-T6P or control without DMNB-T6P with spray composition as for Argentinian experiments (Supplementary Table 2) was applied to spike only at 7 DAA and 14 DAA. Spikes were harvested at maturity; grain yield was measured; and significance was calculated by Studentʼs t-test. Each treatment contained six biological replicates.
Treatment of barley with DMNB-T6P in controlled environment
Spring barley seeds were grown in 21-cm pots containing Rothamsted compost23 under 22 °C/18 °C, 16-h day/night cycles, 500 µmol m−2 s−1 quanta and 60% relative humidity. Regular watering was continued throughout the experiment except for drought stress treatments where watering was reduced at anthesis to 60% of pot weight and maintained at that level of drought until harvest. Twenty milliliters per plant of 2 mM DMNB-T6P or control without DMNB-T6P with spray composition as for Argentinian experiments (Supplementary Table 2) was applied to the upper canopy, including spikes, at 6 DAA and 11 DAA. Spikes were harvested at maturity; grain yield was measured; and significance was calculated by Studentʼs t-test. Each treatment contained six biological replicates.
Reporting summary
Further information on research design is available in the Nature Portfolio Reporting Summary linked to this article.


